Using Snowflake as Your Ingestion Engine: How to Move Data from API to Bronze Without Leaving the Building
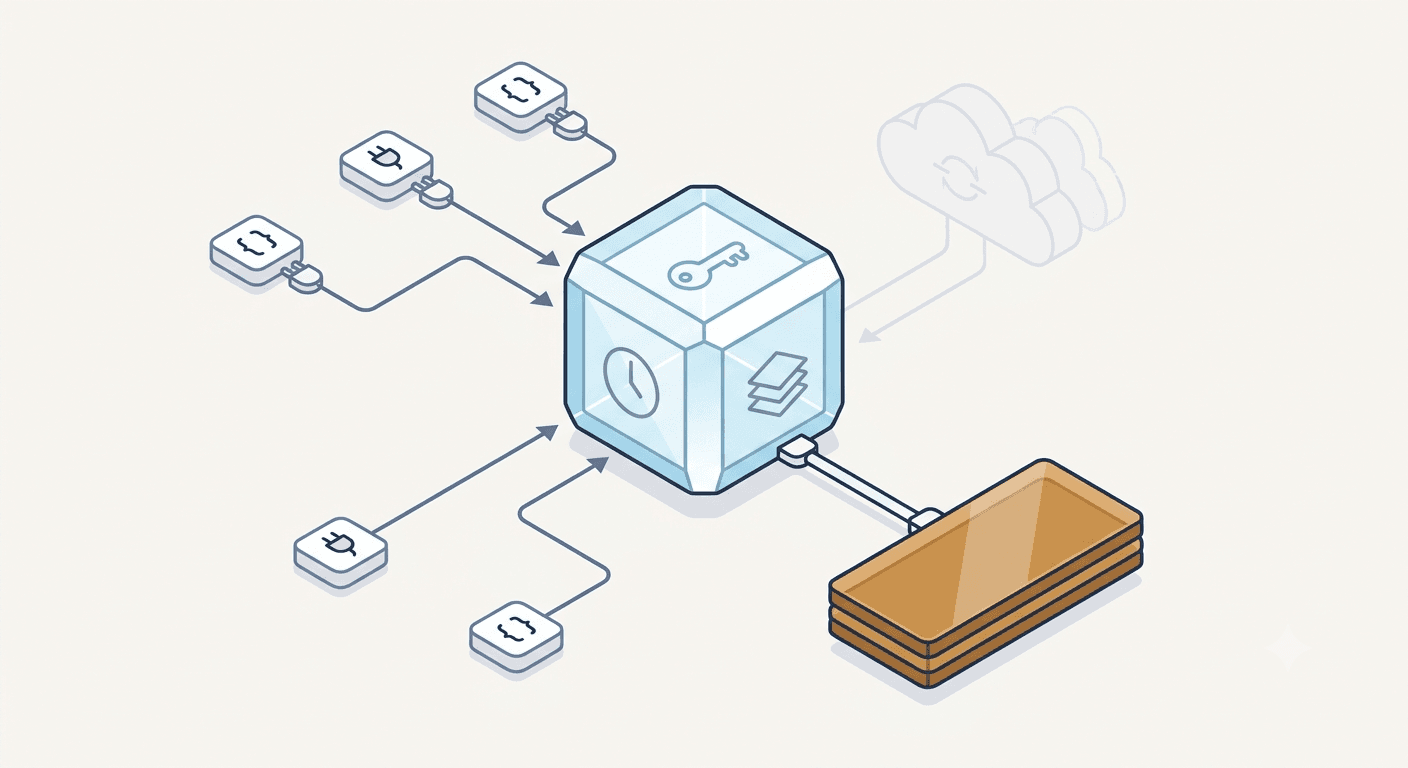
Most ingestion architectures I've seen follow the same pattern: spin up an external compute layer, call some APIs, land the data in object storage, then load it into your warehouse. AWS Lambda, Azure Functions, Airflow, Fivetran. Pick your poison. Each one adds another moving part, another credential to rotate, another bill to reconcile at the end of the month.
If you're in the early stages of your data maturity, that sort of tooling sprawl is exactly what you want to avoid. You might not be a team of 20 engineers with a platform team behind you. You might be a small group trying to get foundational reporting off the ground.
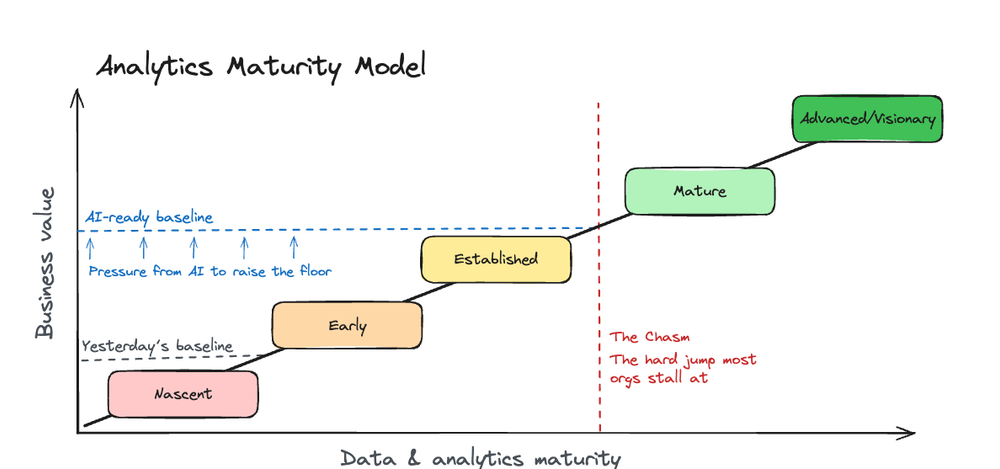
Introducing multiple orchestration tools, managed ETL services, and external compute adds complexity you may not be ready for and costs that are hard to predict. Lean heavily on consumption based tooling early on and a single misconfigured job or runaway Lambda can quietly blow out your monthly spend before anyone notices.
That kind of unpredictable spend is a problem in its own right, and one we've written about before. If your cloud costs are already creeping up, Stop bleeding money in the cloud: Getting started with cloud cost optimisation is a good place to start.
So we asked a different question: what if Snowflake itself was the ingestion engine?
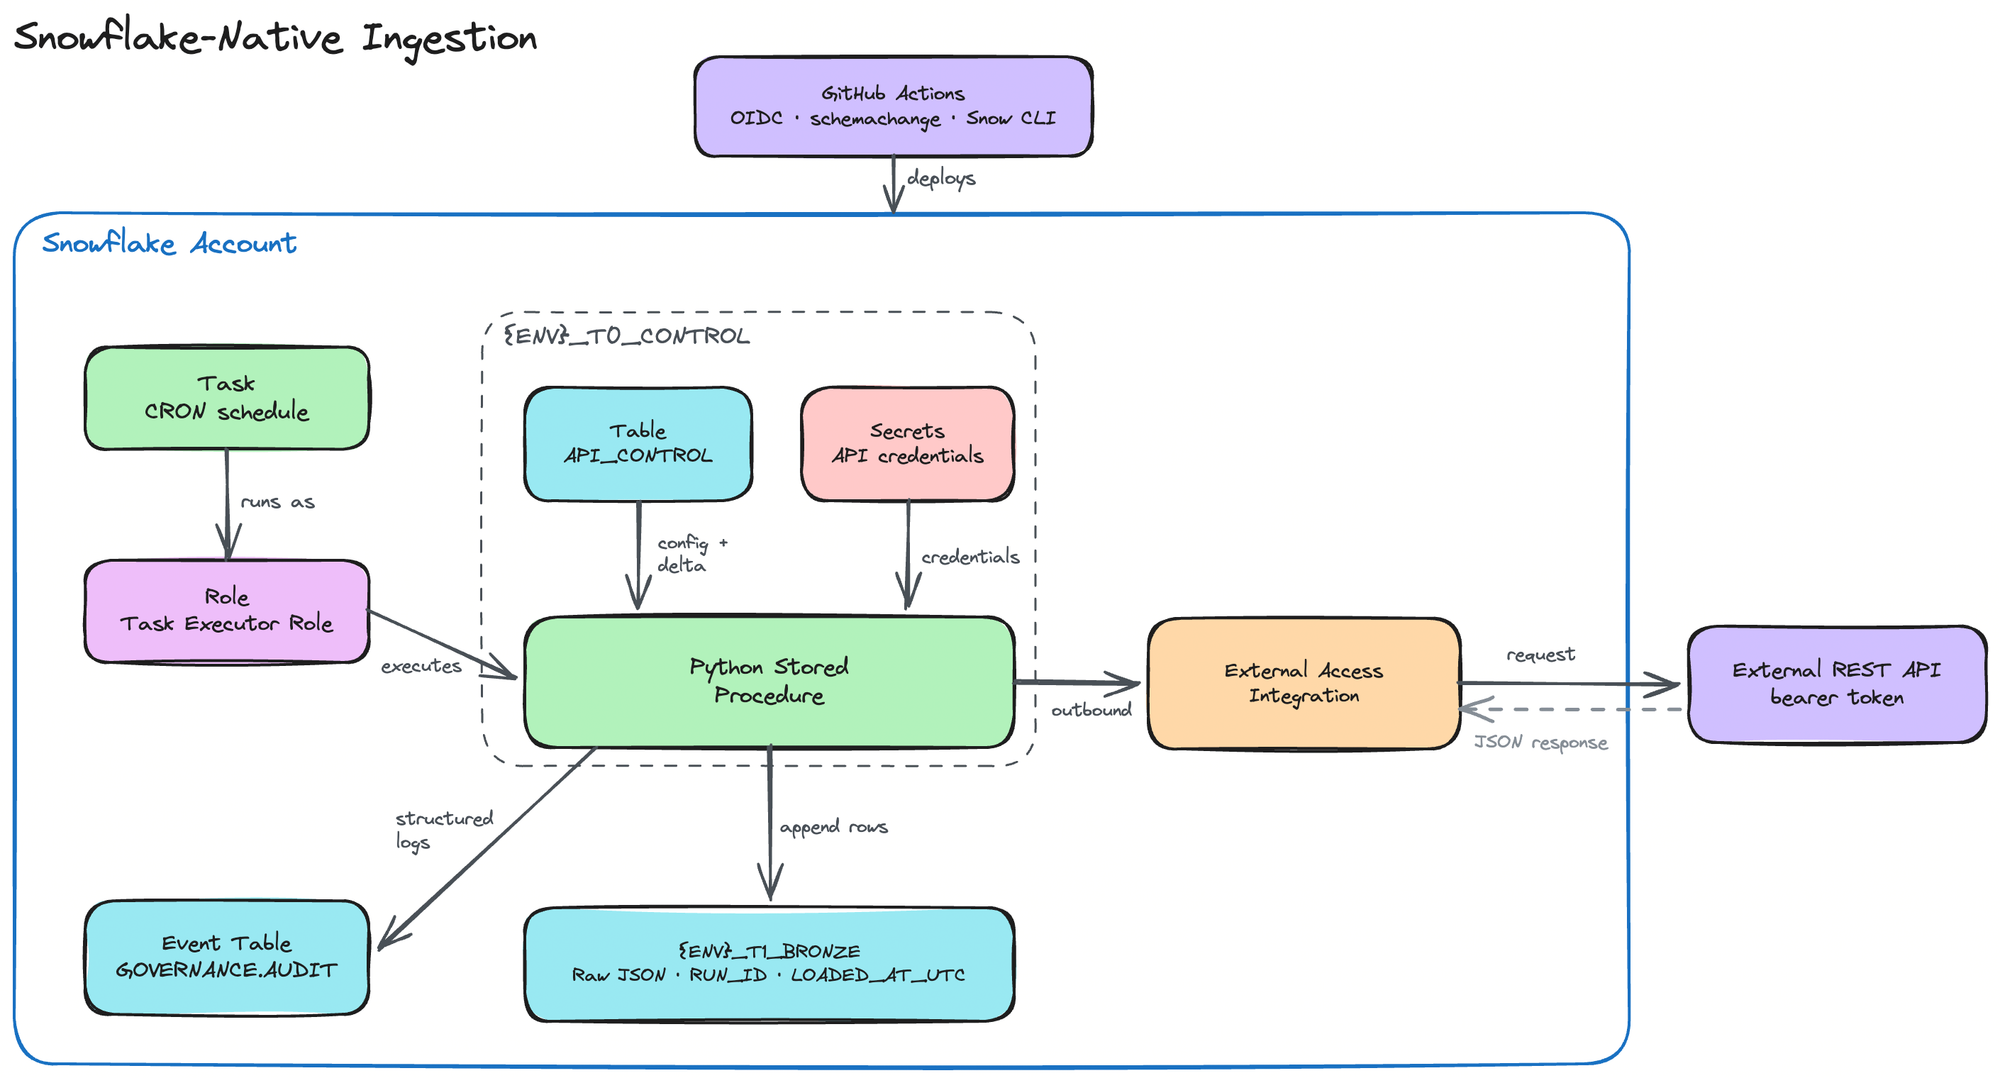
Not Snowflake as the destination. Snowflake as the thing that reaches out to external APIs and lands the responses in the bronze layer: no Lambda, no Airflow, no middleware. The warehouse handles the scheduling, the compute, the secret management, and the network access. Everything lives in one place, deployed through one pipeline.
From the API control table that drives the ingestion, to the Python procedures that do the extraction, to the CI/CD pipeline that deploys the lot - this post walks through how we built that.
Before we get into the how, it's worth being clear on why bronze matters. Bronze is the raw landing zone: the layer every dashboard, model, and downstream transform sits on top of. If extraction is fragile or expensive to run, everything built above it inherits the problem. Get it right, so it's reliable, incremental, and cheap to rebuild from source, and the rest of your platform finally has something to build on.
This walkthrough follows the order we built things in: the one-time bootstrap, the control table that drives ingestion, external access, the Python extraction procedure, scheduling, observability through the event table, and the CI/CD pipeline that ties it all together.
Prerequisites and Bootstrap: The One-Time ACCOUNTADMIN Setup
Before any CI/CD pipeline can run, there's a one-time bootstrap that has to happen with ACCOUNTADMIN. This is the only manual step in the entire process, and it creates the foundational objects that everything else depends on:
- A GOVERNANCE database with schemas for schemachange tracking, audit (the event table), and centralised masking policies
- An account level event table (
GOVERNANCE.AUDIT.EVENT_TABLE) that captures telemetry across all databases - A service user with OIDC workload identity for GitHub Actions (no passwords, no key pairs to rotate)
- An infrastructure warehouse for running the deployments
Go Secretless: Snowflake OIDC with GitHub Actions
The service user authenticates via OIDC, which means GitHub Actions requests a short lived token at runtime rather than storing long lived credentials. If you've read our previous post on secretless authentication, this is the same pattern. The bootstrap also grants the service role the privileges it needs: CREATE DATABASE, CREATE INTEGRATION, EXECUTE TASK, MANAGE GRANTS, and so on. These are broad, but they're scoped to a single service role that only CI/CD uses.
CREATE USER SVC_ACCOUNT_DEPLOY_GITHUB_USER
    DEFAULT_ROLE      = SVC_ACCOUNT_DEPLOY_GITHUB_ROLE
    TYPE              = SERVICE
    WORKLOAD_IDENTITY = (
        TYPE    = OIDC
        ISSUER  = 'https://token.actions.githubusercontent.com'
        SUBJECT = 'repo:<org>/<repo>:environment:ACCOUNT'
    );
One thing worth noting: Snowflake best practice recommends using SYSADMIN and SECURITYADMIN for certain objects, but we opted for ACCOUNTADMIN in the bootstrap because everything after this point is managed via the CI/CD role. The bootstrap is the handoff.
The Control Table: Driving Ingestion with Config
The core of the ingestion pattern is a control table called API_CONTROL. It lives in {ENV}_T0_CONTROL.JOB_CONTROL and acts as the single source of truth for what gets ingested, from where, and how far through we are.
CREATE TABLE IF NOT EXISTS {ENV}_T0_CONTROL.JOB_CONTROL.API_CONTROL (
    SOURCE_NAME             VARCHAR,
    ENDPOINT                VARCHAR,
    SECONDARY_ENDPOINT      VARCHAR,
    DELTA_KEY               VARCHAR,
    DELTA_VALUE             VARCHAR,
    LAST_RUN_ID             VARCHAR,
    LAST_RUN_STATUS         VARCHAR,
    LAST_RUN_ROWS           NUMBER,
    LAST_RUN_TIME_UTC       TIMESTAMP_NTZ,
    DESTINATION_TABLE_NAME  VARCHAR
);
The columns that matter most here are DELTA_KEY and DELTA_VALUE. These two fields are what turn a full load into an incremental one. DELTA_KEY stores the name of the field used for tracking (e.g. a revision ID, a last modified timestamp) and DELTA_VALUE stores the last known high watermark. Each run reads the current delta value, fetches only records beyond that point, and then advances the watermark after a successful load.
The table is populated via a MERGE statement that's idempotent by design. If a row already exists (matched on SOURCE_NAME, ENDPOINT, SECONDARY_ENDPOINT), it's left untouched. This means the delta value is never accidentally reset by a redeployment:
MERGE INTO {ENV}_T0_CONTROL.JOB_CONTROL.API_CONTROL AS target
USING (
    VALUES
    ('SOURCE_A', '/api/v2/endpoint', NULL, 'SysRevID',
     '{ENV}_T1_BRONZE.SOURCE_A.TABLE_NAME'),
    ...
) AS source (SOURCE_NAME, ENDPOINT, SECONDARY_ENDPOINT,
             DELTA_KEY, DESTINATION_TABLE_NAME)
ON target.SOURCE_NAME = source.SOURCE_NAME
AND target.ENDPOINT = source.ENDPOINT
AND (target.SECONDARY_ENDPOINT = source.SECONDARY_ENDPOINT
     OR (target.SECONDARY_ENDPOINT IS NULL
         AND source.SECONDARY_ENDPOINT IS NULL))
WHEN NOT MATCHED THEN INSERT (
    SOURCE_NAME, ENDPOINT, SECONDARY_ENDPOINT,
    DELTA_KEY, DESTINATION_TABLE_NAME
) VALUES (
    source.SOURCE_NAME, source.ENDPOINT, source.SECONDARY_ENDPOINT,
    source.DELTA_KEY, source.DESTINATION_TABLE_NAME
);
Adding a new endpoint to the ingestion is just adding a row to this VALUES clause and deploying. The Python code picks it up automatically.
External Access: Network Rules, Secrets, and Integrations
Snowflake doesn't let stored procedures make outbound HTTP calls by default. You need to explicitly declare what external hosts a procedure is allowed to reach and what credentials it can use. This is done through three objects that work together:
Network rules define the allowed egress destinations:
CREATE OR REPLACE NETWORK RULE api_network_rule
    MODE = EGRESS
    TYPE = HOST_PORT
    VALUE_LIST = ('*.your-api-provider.com');
Secrets store the API credentials as generic strings, injected at deploy time via Jinja variables from GitHub Actions secrets:
CREATE OR REPLACE SECRET api_user
    TYPE = GENERIC_STRING
    SECRET_STRING = '{{ api_user }}';

CREATE OR REPLACE SECRET api_pwd
    TYPE = GENERIC_STRING
    SECRET_STRING = '{{ api_pwd }}';
External access integrations tie the network rules and secrets together and get attached to the stored procedure:
CREATE OR REPLACE EXTERNAL ACCESS INTEGRATION {ENV}_API_INTEGRATION
    ALLOWED_NETWORK_RULES = (api_network_rule)
    ALLOWED_AUTHENTICATION_SECRETS = (api_user, api_pwd)
    ENABLED = TRUE;
The integration is then granted to the task executor role so the scheduled task can actually use it. This is a deliberate separation: the CI/CD role creates the integration, but the task executor role is what runs with it at runtime.
It's worth dwelling on what this buys you. A stored procedure can only reach the hosts named in its network rule, and only with the secrets named in its integration. If the Python code were ever compromised and tried to POST bronze data to some other host, the call would simply fail, because that host was never in the VALUE_LIST. Egress is on the allow list by default, declared in code, and reviewable in a pull request. Compare that to a Lambda dropped in a default VPC, which can talk to anything on the open internet unless someone has gone out of their way to lock the security groups down. Here the restrictive posture is the starting point rather than something you have to remember to add later.
The Python Procedure: Extraction Logic on a Stage
The actual extraction logic is written in Python and lives as a .py file uploaded to an internal Snowflake stage. It's not embedded inline in the SQL procedure definition. This matters because it means the Python code is version controlled in the repo, uploaded during CI/CD, and imported at runtime.
The internal stage is straightforward:
CREATE OR REPLACE STAGE SNOWFLAKE_INFRASTRUCTURE
    DIRECTORY = (ENABLE = true)
    ENCRYPTION = (TYPE = 'SNOWFLAKE_SSE');
The procedure declaration references the stage for imports:
CREATE OR ALTER PROCEDURE extract_and_load()
    RETURNS TEXT
    LANGUAGE PYTHON
    EXTERNAL_ACCESS_INTEGRATIONS = ({ENV}_API_INTEGRATION)
    SECRETS = ('api_user' = api_user, 'api_pwd' = api_pwd)
    RUNTIME_VERSION = '3.13'
    PACKAGES = ('snowflake-snowpark-python', 'requests')
    HANDLER = 'module.extract_and_load_all'
    IMPORTS = ('@snowflake_infrastructure/python/module.py',
               '@snowflake_infrastructure/python/logger.py')
    LOG_LEVEL = INFO;
A few things worth calling out here:
EXTERNAL_ACCESS_INTEGRATIONSgrants the procedure the ability to make outbound HTTP calls through the integration we created earlierSECRETSmakes the API credentials available inside the procedure viasnowflake.snowpark.secrets.get_generic_secret_string()IMPORTSpulls the Python files from the internal stage at runtime. No need to package them into a wheel or a zipLOG_LEVEL = INFOmeans log output from the Pythonloggingmodule is captured by the account level event table
One caveat on the syntax: CREATE OR ALTER (used here and for the task later on) is a Snowflake Preview feature at the time of writing. It's open to all accounts, but if you'd rather stick to GA syntax the same definitions work with CREATE OR REPLACE.
Don't Burn Your Data - Freeze Your Requirements!
The Python code itself follows a simple pattern:
- Read the
API_CONTROLtable for all endpoints belonging to a source - For each endpoint, build the delta filter from the stored watermark
- Paginate through the API using keyset pagination (not offset, which degrades at scale)
- Serialise each page of JSON records and append them to the bronze table with
RUN_IDandLOADED_AT_UTCmetadata - After all pages are loaded, update
DELTA_VALUEinAPI_CONTROLto the new high watermark
# Keyset pagination — avoids performance degradation from large skip values
while True:
    params["$top"] = page_size
    params["$filter"] = f"{delta_key} gt {cursor}"
    page_data = client.get_data(endpoint, params)
    if not page_data:
        break
    insert_data(session, run_id, run_time, page_data, target_fqn)
    cursor = max(record[delta_key] for record in page_data)
    if len(page_data) < page_size:
        break
The secrets are resolved at runtime inside the procedure. For local development, the code falls back to environment variables, so the same script runs locally against a dev environment without modification:
self.user = os.environ.get("API_USER") or secrets.get_generic_secret_string("api_user")When a Run Fails: Layered Errors and a Clean Boundary
Ingestion breaks in messy ways: an API times out mid-page, a payload comes back with an unexpected shape, a single endpoint starts throwing 500s while the rest are fine. We wanted two things out of a failure: enough context to actually debug it, and a task history that stays readable.
The first piece is a small step() context manager that wraps whatever's happening into a single layered IngestionError. Each layer tags on some context (the source, the endpoint, the watermark it was working from), so a failure reads like a trail of what was being attempted rather than a bare stack trace:
with step("load endpoint", endpoint=endpoint.path, delta=cursor):
    page = client.get_data(endpoint.path, params)
    insert_data(session, run_id, run_time, page, target_fqn)
Nesting these produces one exception carrying the whole trail rather than a chain of N wrapped exceptions, which keeps the Snowflake traceback down to a couple of frames instead of a wall of them.
The second piece is that a failed endpoint doesn't abort the run. Failures are collected per endpoint, so if /employees falls over, /timesheets still loads. At the end of the run the context manager decides the outcome for the source as a whole.
That decision happens at the procedure boundary. When the IngestionContext exits, it logs the full error chain and Python traceback to the event table as structured fields, then raises a deliberately terse exception:
raise IngestionFailed(run_id=self._run_id) from NoneThe from None matters. It suppresses the nested cause chain so that Snowflake's TASK_HISTORY.ERROR_MESSAGE only ever shows Ingestion failed: run_id=<...>. The short message points you at the run; the run's structured log line in the event table carries the detail. You get both: a clean task history, and the full context one query away.
Scheduling Ingestion with Snowflake Tasks and Least-Privilege Roles
The task is what ties everything together. It's a Snowflake scheduled job that calls the stored procedure on a cron schedule:
CREATE OR ALTER TASK INGEST_TASK
    WAREHOUSE = {ENV}_INGEST_WH
    ALLOW_OVERLAPPING_EXECUTION = FALSE
    USER_TASK_TIMEOUT_MS = 18000000
    SCHEDULE = 'USING CRON 0 1 * * * Australia/Perth'
AS
    CALL extract_and_load();
One note on ALLOW_OVERLAPPING_EXECUTION = FALSE: it still works, but it's now deprecated in favour of OVERLAP_POLICY = NO_OVERLAP. Both do the same job here, stopping a run from starting while the previous one is still going.
The schedule, the warehouse, and the task state (resumed or suspended) are all parameterised per environment using Jinja:
{% set task_schedule = {
    'dev':  'USING CRON 0 1 * * * Australia/Perth',
    'test': 'USING CRON 0 1 * * * Australia/Perth',
    'prod': 'USING CRON 0 1 * * * Australia/Perth'
}[environment|lower] %}

{% set task_state = {
    'dev':  'RESUME',
    'test': 'SUSPEND',
    'prod': 'SUSPEND'
}[environment|lower] %}
This means deploying to DEV automatically starts the task running, while TEST and PROD deployments create the task in a suspended state until you're ready to go live. Same code, different behaviour per environment.
After creation, ownership of the task is transferred to a dedicated {ENV}_TASK_EXECUTOR_ROLE. This is a least privilege pattern: the CI/CD role creates and configures the task, but the task runs under a role that only has the permissions it actually needs:
USAGEon the ingest warehouseSELECTandUPDATEonAPI_CONTROL(read config, advance delta)READon the stage (for Python imports) and secrets (for API creds)INSERTandCREATE TABLEonT1_BRONZE(write ingested data)
GRANT OWNERSHIP ON TASK INGEST_TASK
    TO ROLE {ENV}_TASK_EXECUTOR_ROLE COPY CURRENT GRANTS;
The task executor role can't create databases, drop tables, or modify integrations. It can only do exactly what the ingestion needs.
The Event Table: Observability Without Extra Tooling
One of the underappreciated features in Snowflake is the account level event table. When you set LOG_LEVEL = INFO on a stored procedure, every call to Python's logging module gets captured and stored in GOVERNANCE.AUDIT.EVENT_TABLE.
This is set up during the bootstrap:
CREATE EVENT TABLE GOVERNANCE.AUDIT.EVENT_TABLE;
ALTER ACCOUNT SET EVENT_TABLE = GOVERNANCE.AUDIT.EVENT_TABLE;
From there, you can query it like any other table. Filter by timestamp, by the procedure name, by log level. It's not a replacement for a dedicated observability platform, but for a team that doesn't have one yet, it's a solid starting point. You get structured logs from your ingestion tasks without configuring a third party logging service.
Combined with the custom TaskLogger that attaches run_id, source, endpoint, and target to every log line, you get enough context to debug a failed run without SSH'ing into anything (because there's nothing to SSH into).
Finding failed runs, for instance, is a single query. Because the TaskLogger writes its context into RECORD_ATTRIBUTES, you can filter on severity and pull the run id, source, and endpoint back out in one go:
SELECT
    TIMESTAMP,
    RECORD_ATTRIBUTES:run_id::VARCHAR    AS run_id,
    RECORD_ATTRIBUTES:source::VARCHAR    AS source,
    RECORD_ATTRIBUTES:endpoint::VARCHAR  AS endpoint,
    VALUE::VARCHAR                       AS message
FROM GOVERNANCE.AUDIT.EVENT_TABLE
WHERE RECORD_TYPE = 'LOG'
  AND RECORD:severity_text = 'ERROR'
  AND TIMESTAMP > DATEADD('day', -1, CURRENT_TIMESTAMP())
ORDER BY TIMESTAMP DESC;
This is the "one query away" claim from the error handling section made good. The task history hands you a run id, and this is where you come to see what actually happened behind it.
CI/CD: Deploying the Whole Thing
The deployment pipeline is a single GitHub Actions workflow split into three phases. It uses schemachange for SQL migrations and the Snowflake CLI for file uploads.
Go Secretless: Snowflake OIDC with GitHub Actions
Phase 1: Base infrastructure. Deploys schemas, tables, integrations, stages, network rules, secrets, and access roles. This creates the scaffolding that everything else depends on.
Phase 2: Upload Python scripts. Uses snow stage copy to push the .py files from the repo to the internal stage. This has to happen after Phase 1 (the stage needs to exist) and before Phase 3 (the procedures reference the files).
- name: Upload Python scripts to stage
  run: |
    snow stage copy "./stage/*" @snowflake_infrastructure/python \
      --database ${{ env.ENVIRONMENT }}_T0_CONTROL \
      --schema JOB_CONTROL \
      --overwrite -x -v
Phase 3: Workloads. Deploys the stored procedures and tasks. The procedures reference the Python files uploaded in Phase 2 via IMPORTS.
All three phases use schemachange with Jinja templating. The environment name and secrets are passed as SCHEMACHANGE_VARS, which means the same SQL templates produce different objects depending on whether you're deploying to DEV, TEST, or PROD:
SCHEMACHANGE_VARS: |
  {
    "environment": "${{ env.ENVIRONMENT }}",
    "api_user": "${{ secrets.API_USER }}",
    "api_pwd": "${{ secrets.API_PASSWORD }}"
  }
Each phase tracks its own change history in a separate schemachange table ({ENV}_T0_CONTROL.SCHEMACHANGE.BASE, PROJECTS, WORKLOADS), so you can redeploy workloads without re running the base infrastructure scripts.
Network Policy: Controlling Inbound Access to Snowflake
At the account level, there's a network policy that restricts which IP addresses can connect to the Snowflake account:
CREATE NETWORK POLICY IF NOT EXISTS ACCOUNT_LEVEL_NETWORK_POLICY;

ALTER NETWORK POLICY IF EXISTS ACCOUNT_LEVEL_NETWORK_POLICY SET
    ALLOWED_IP_LIST = (
        'x.x.x.x/32',   -- Office
        'x.x.x.x/32',   -- Data Centre - Primary
        'x.x.x.x/32'    -- Data Centre - Secondary
    );
This is separate from the network rules on the external access integrations. The network policy controls who can connect in to Snowflake. The network rules control what the stored procedures can reach out to. Both are defined in code and deployed through CI/CD.
The naming doesn't help, so it's worth being explicit. A network policy is attached to the account (or to a user) and governs inbound connections: it answers "which IP addresses are allowed to log in". A network rule with MODE = EGRESS is attached to an external access integration and governs outbound connections: it answers "which hosts is this stored procedure allowed to call". They point in opposite directions and are enforced at different layers. One keeps unauthorised clients out, the other stops your own code from reaching hosts it has no business talking to. When they get mixed up it usually surfaces as a procedure that can't reach its API (a missing egress rule) or a client refused at login (the network policy), and the error messages don't always make the direction obvious.
What You End Up With: The Full Ingestion Flow
When all of this is deployed, the ingestion flow looks like this:
- A cron scheduled task fires at 1 AM Perth time
- The task runs under a least privilege role with only the grants it needs
- The stored procedure reads the control table for endpoints and delta state
- For each endpoint, it authenticates using secrets stored in Snowflake
- It makes outbound API calls through a declared external access integration
- JSON responses are serialised and appended to the bronze layer with load metadata
- The delta value is advanced so the next run picks up where this one left off
- Logs are captured in the account level event table for observability
No Lambda. No Airflow. No Fivetran. No external compute. The warehouse that runs the query is the same warehouse that pulls the data in.
Tradeoffs and Limitations of Scheduled Batch Ingestion in Snowflake
This pattern earns its keep for scheduled batch ingestion, but it's worth being clear about where it stops.
The first constraint is latency. This is a batch pattern, not a streaming one: a task fires on a cron, so you're measuring freshness in minutes rather than milliseconds. A cron schedule is minute-granular at its finest, and while tasks can go sub minute with an interval schedule (SCHEDULE = '10 SECONDS'), that's still polling on a timer, not reacting to events. If you need sub second reaction to individual events, this is the wrong tool and you'd reach for something like Kafka or Snowpipe Streaming. For reporting where the question is usually "what happened yesterday", a nightly or hourly pull is plenty.
The second is compute cost, the flip side of what makes the pattern attractive. Because the warehouse does the extraction, it stays active for the entire run. If a throttled endpoint takes twenty minutes to page through, that's twenty minutes of warehouse credits spent mostly waiting on network I/O. A Lambda would bill only for execution time, which for a slow, chatty API can work out cheaper. We took that trade knowingly: some inefficiency on slow endpoints in exchange for no external compute to run and secure. For a workload dominated by slow third party APIs, the numbers might point the other way.
Two smaller edges: a single stuck endpoint holds the warehouse open until USER_TASK_TIMEOUT_MS cuts it off, so set that deliberately; and a failed endpoint is retried on the next scheduled run, not immediately, which is fine for daily data but a gap for anything time sensitive.
Getting Dynamic with Snowflake: How They’re Reshaping Data Pipelines
Conclusion
For a client early in their data journey, the goal wasn't to build the most sophisticated pipeline. It was to build something that worked, that they could understand, and that didn't require managing a constellation of external services. Snowflake's external access integrations, stored procedures, tasks, and secret management gave us enough to build a complete ingestion layer without ever leaving the platform.
The entire infrastructure is defined in SQL and Python, version controlled in a single repo, and deployed through a single CI/CD pipeline. Adding a new API endpoint means adding a row to the control table and a few lines of config. There's no new infrastructure to provision, no new service to monitor.
It's not the right approach for every situation. But for a team that needs to get data flowing without drowning in tooling, it's a solid starting point.
Are you starting your data journey?
Here at Mechanical Rock, we like finding the boundaries of a tool by pushing on them. If you're early in your data journey and want to get reporting off the ground without a sprawl of external services, or you've got a data problem you're not sure how to tackle, lets chat.